
Magnetic Resonance Techniques for Assessing in Vivo pH
- Article
- Article Info
- Author Info
Abstract
pH is a highly monitored parameter inside the body and slight changes in pH lead to disrupted biochemical activities. Many diseases, such as ischemia, inflammation, and cancer are associated with pH changes. Therefore, it is important to measure a precise pH in vivo to evaluate the disease status and to devise a better treatment plan. In this mini review, we have described the magnetic resonance imaging and spectroscopy tools available to determine the in vivo extracellular and intracellular pH. The strengths, weaknesses, and potential solutions to overcome those weaknesses are also summarized in the review.
Introduction
The pH in biological systems is highly maintained and monitored by the body. The immediate response to any change in the physiological pH is chemical changes [1]. Many biochemical reactions, binding affinities, enzymatic actions, and chemical equilibria are affected by slight changes in pH or proton concentration [1,2]. pH changes also affect drug delivery to the target site and influence drug action. pH balance is primarily regulated by the equilibrium between bicarbonate (HCO3–) and carbon dioxide (CO2), and sometimes by altered metabolism. Changes in pH in vivo are encountered in many diseases, such as ischemia, inflammation, infection, renal failure, and cancer. Therefore, it is crucial to measure and monitor pH precisely and accurately in vivo. Intracellular pH (pHi) and extracellular pH (pHe) can be different, therefore both should be considered while performing and evaluating pH measurements. For example, for solid tumors, the pHi ranges between 7.1 -7.5 whereas pHe ranges between 6.3-7.0.
Magnetic resonance imaging (MRI) is a non-invasive imaging modality with outstanding soft tissue imaging contrast and the ability to provide deep tissue imaging. Several MRI-based methods are already used to measure pH in vivo. In this mini review, we outline all of the available MRI-based methods employed to interrogate pH in vivo and discuss their specific applications and limitations. We first review MR spectroscopy and spectroscopic imaging methods that directly rely on the MR chemical shift to measure pH. We then review an MRI method that employs chemical shifts to measure pH through chemical exchange processes. Finally, we review MRI methods that rely on longitudinal (T1) and transverse (T2) relaxation parameters to measure pH, including simultaneous Positron Emission Tomography (PET)/MRI methods.
31P Magnetic resonance spectroscopy
Phosphorus is present in cells as an inorganic phosphate (Pi) and organic phosphates such as in ATP, ADP, DNA, and RNA, and plays an important role in energy metabolism, cell growth, and cell sustainability. Phosphorus is the second most abundant mineral in the body after calcium and the MR active 31P is a 100% abundant. Despite the abundance, 31P MRS is only 6.6% as sensitive as 1H MRS. The wide chemical shift range of about -150 to 200 ppm facilitates the detection of pH-dependent differences in 31P chemical shifts. Most 31P is contained within cells, and 31P MRS chemical shifts can be used to measure pHi [3,4].
Pi exists as the ions of HPO42- and HPO41-, and they exchange rapidly with each other at a rate of ~109 -1010 s-1, appearing as a single resonance in the MR spectrum. The calibration curve of the chemical shift of 31Pi with pH was established [5]. This 31P MRS-pH calibration was used to demonstrate acidosis in ischemic rat hearts. The pHi of normal heart measured by employing the Pi chemical shift was 7.05 ± 0.02 (mean ± SEM), where the ischemic heart pH dropped to 6.2 ± 0.06 [5]. 31P MRS was also employed in the clinical diagnosis of a patient with McArdle’s syndrome, an inborn error in metabolism caused by a lack of glycogen phosphorylase activity in skeletal muscle [6]. The intramuscular pH measured with 31P MRS decreased from 7.02 ± 0.01 to 6.7 ± 0.10 in five healthy volunteers whereas a patient with McArdle’s syndrome had an intramuscular pH that did not fall below 7.0 during ischemic exercise [6]. In another study, the in vivo pHi of normal brain, normal liver, brain tumors, and liver tumors was measured using a 31P Pi chemical shift in 15 patients. A significant difference was observed in the pH of brain tumors (7.14 ± 0.12) compared to healthy brain controls (7.03 ± 0.04). The liver tumor pH measured using 31P MRS after embolization showed a decrease in pH from 7.15 to 6.8 [7]. As another example, in vivo brain pH was measured in 35 healthy men using the 31P chemical shift of Pi relative to phosphocreatine [8]. However, the choice of calibration between pH and the 31P chemical shift difference is imperative to determine accuracy and precision, as multiple calibrations are available.
The pHe and pHi of radiation-induced fibrosarcoma-1 tumors were measured by the intraperitoneal injection of 3-aminopropylphosphonate (3-APP) by 31P MRS [9,10]. The 5 mM 3-APP pH measurements were calibrated using the growth medium of C6 glioma cell culture, where external pH varied. The in vivo pHe reported using 3-APP in RIF-1 bearing mice was 6.66 ± 0.15 and at the same time intracellular pH reported by the chemical shift of Pi was 7.25 ± 0.05. The 3-APP chemical shift was reported to be inert to temperature and ionic changes in the same study. The structure of 3-APP is analogous to that of γ-aminobutyric acid, which is a neurotransmitter; thus, 3-APP is a potential neurotoxin. The neurotoxicity concern, low spatial resolution, long acquisition times, and specialized coil requirements have hindered the routine clinical application of 3-APP [11]. Another agent, phenylphosphonic acid (PPA), has also been used to measure pHe by 31P MRS in perfused rabbit bladder tissues and arterially perfused cat biceps [12,13]. PPA resonated at 12.77 ± 0.02 ppm downfield to the endogenous phosphatic compounds. The PPA calibration curve showed pH-dependent chemical shift of PPA resonance in the range of 6.4-7.6 with ± 1.12 ppm/unit pH. Furthermore, PPA has been reported to be susceptible to ion-dependent chemical shift changes that lead to errors in pHe measurement in vivo.
19F Magnetic resonance spectroscopy
19F is nearly as sensitive to 1H as its receptivity is 0.83 (where the receptivity of 1H is defined as 1.0). 19F is also sensitive to changes in the environment, resulting in changes in chemical shifts or relaxation rates [14]. Intracellular peripheral blood lymphocyte pH was measured using 19F Nuclear Magnetic Resonance (NMR) spectroscopy by the agent D,L-2-amino-3,3-difluoro-2-methylpropanoic acid (F2MeAla) [15]. F2MeAla methyl ester was taken up by lymphocytes and hydrolyzed to free amino acid inside the cell, and this agent showed pH dependent 19F shifts as the alpha amino group is protonated at lower pH. Internalization of agent was confirmed by an acquired NMR spectrum on media and cell lysate. The 19F NMR spectroscopy of F2MeAla methyl ester (α- amine group on F2MeAla has a pKa 7.2) observed a quartet resonance centered at -55.7 ppm, and the peak spacing adjacent to the center of the quartet (δ2 – δ3) changed with pH of the solution with changes of 0.9 ppm/pH unit between pH 6.6-7.8 [15]. In another study, hepatic pHi was measured in vivo using the 19F agent F-Quene 1, whose results were in agreement with those measured by 31P MRS. F-Quene 1 is a pH determining agent in the range of 5 to 8 ppm and shown to have large chemical shift change of >1 ppm/pH unit [16]. The intrahepatic pH of rats measured with F-Quene 1 was 7.18 ± 0.01 which was in close agreement with pHi measured with 31Pi 7.26 ± 0.02. The pH indicator F2MeAla was used in RINm5F cells and P.denitrificans to assess the pHi by 19F NMR spectroscopy [17]. Another agent, 6-trifluoromethylpyridoxine was employed to measure the pHe of various tumors [18] as its pKa is 6.83 and chemical shift changes are 0.4 ppm/pH unit. The pH of Langendroff perfused rat heart was measured using 6-trifluoromethylpyridoxine and pHe was found to be 7.39 at 25 0C based on chemical shift of 19F δF = 16.41 (Figure 1). This pHe measurement from 19F was validated by a pHe measurement using 31P NMR spectroscopy. The whole rabbit blood pHe was measured to be 7.44 by 19F NMR spectroscopy of 6-trifluoromethylpyridoxine resonating at 16.52 ppm [18].
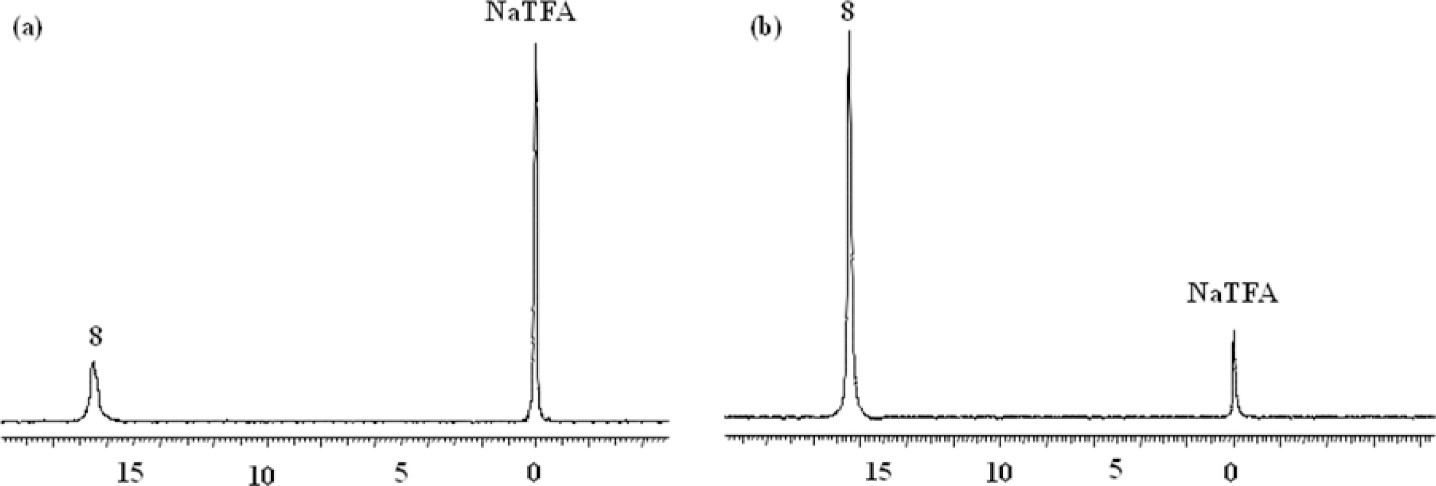
Figure 1: Adapted with permission from Yu JX, et al. [18]. a) A Langendroff perfused rat heart pH was measured with 6-trifluoromethylpyridoxine. The 19F NMR acquired at 376 MHz at 25 °C and pHi measured was 7.39 based on chemical shift 16.41 ppm (19F). b) The whole rabbit blood pH was found to be 7.74 based on the 19F chemical shift of 6-trifluoromethylpyridoxine. Trifluoro acetic acid sodium salt (NaTFA) is the 19F NMR reference that appears at 0 ppm.
Various 19F NMR agents have been designed to address the changes in pH on the basis of modifications of an amine group in the agent [14,19]. The 19F NMR agents that have been used to measure pH are (1) 3-fluoro-2-methyl alanine, (2) 3,3-difluoro-2-methyl alanine, (3) 3,3,3-trifluoro-2-methyl alanine, (4) PFONP: 4-fluoro-2-nitrophenol, (5) 5F-BAPTA: 5,5-difluoro-1,2-bis(o-aminophenoxy)ethane-N,N,N′,N′-tetraacetic acid, (6) PCF3ONP: 4-trifluoro-2-nitrophenol, (7) 4-hydroxyphenylsulfurpentafluoride, (8) HFB: hexafluorobenzene, (9) CCI-103F, (10) 5-methoxy-1,2-dimethyl-3-[[2,2,2-trifluoro-1,1-bis(trifluoromethyl)ethoxy] methyl]-1H-indole-4,7-dione, (11) dimeric 3,5-bis-(trifluoromethyl)benzenyl moiety, and (12) 15C5: perfluoro-15-crown-5-ether [14]. The recently identified hydrazine-based molecular entities are pH-sensitive and show changes in the 1.8-ppm chemical shift in the CF3 group between acidic and basic solutions [19]. Despite efforts to develop new 19F agents, 19F MRS/I remains challenging. Even though fluorine has zero background noise, high abundance, and a high gyromagnetic ratio compared to 31P and 13C, it is still not sufficiently sensitive to achieve adequate spatial resolution. The limitation of in vivo pH measurement using fluorinated agents is their instability and off target accumulation [20].
1H Magnetic resonance spectroscopy
1H magnetic resonance spectroscopy is a commonly used and established technique for diagnosing many diseases [21-23]. However, measuring pH is one of its less common applications. 1H MRS sensitivity is high compared to any other MR active nuclei except the tritium (3H). However, unlike pH measurements with 31P MRS, there is no available endogenous pH indicator at a detectable concentration for 1H MRS by chemical shift change. Therefore, exogenous agents with chemical shifts that are sensitive to pH must to be administered. In vitro experiments of intact erythrocytes incubated with imidazole showed that the chemical shifts of two aryl protons change as a result of imidazole protonation state, and are therefore a good indicator of pHi [24]. Specifically, the C2 proton ranges between 7.7 -8.7 ppm and the C4 proton ranges between 7.1-7.5 ppm depending on pH [24]. Furthermore, carnosine which contains an imidazole has been shown to be a good pHi indicator by 1H NMR spectroscopy in skeletal muscle [25]. The proton resonance of C2 carnosine ranges from 8.55 to 7.6 ppm and C4 protons between 7.24 to 6.9 ppm when pH varies from 5 to 9. The human skeletal muscle pH recovery from acidic to neutral after exercise has been shown with C2 and C4 proton chemical shift changes and is in close agreement with pH obtained from 31P MRS of Pi.
Several agents containing an imidazole moiety have been tested for in vivo pH measurement, the most promising of which was 2-imidazole-1-yl-3-ethoxycarbonylpropionic acid (IEPA) [26]. The C2 proton of IEPA ranges from 8.85 ppm to 7.8 ppm as pH varies from 5 to 8. The intensity of the C2 proton MR signal decreases with increased pH due to decrease in T2 from 101 ± 12 msec to 61 ± 4 msec [26]. IEPA was used to measure and map the pHe in rat glioma tumors by 1H MRS [27]. A dose of 3 mM IEPA was injected into the glioma rats through jugular vein and MRSI was acquired starting at 50 minutes after injection until 90 minutes post injection. The average pHe measured in 4 rat gliomas from IEPA was 7.084 ± 0.017 which is acidic compared to normal tissues. In the same study, pH obtained from IEPA was matched to the spatial distribution of lactate. However, there was a mismatch between the observed local distributions of lactate and the pHe [27]. Another in vivo pH indicator, (±) 2-(imidazol-1-yl) succinic acid (ISUCA), was introduced to study the correlations of lactate distribution with pH in rat glioma tumors. The C2 proton of ISUCA is pH sensitive and varies from 7.7 to 8.8 ppm with decreasing pH and is used to measure pHe. However, the spatial distribution of lactate and pH measured using ISUCA were not very well correlated in these C6 glioma rats. It was concluded that proton efflux and influx was the cause of low pH at a distance from the site of the higher lactate concentration [28]. In one study, ISUCA was used to map the pHe to evaluate the influence of enzyme carbonic anhydrase IX (CAIX) by hydrating CO2 in the tumor microenvironment [29]. In this study the pHe of CAIX -expressing tumors showed 0.15 lower pH compared to that of tumors in control mice. However, the pHi of both CAIX expressing tumors and control tumors remained the same as obtained from 31P MRS. The pH-sensitive imidazole or histidine was used to measure the pHi of cancer cells by diffusion-weighted imaging rather than by 1H MRS [30]. The diffusion weighted spectrum was acquired on cells incubated for two hours with 10 mM histidine.
Two new MRS resonances of histidine appeared and were assigned to intracellular histidine. Their chemical shift difference was used to estimate a pHi of 7.1 [30]. The concentrations of these agents must be high for MRS detection and these high concentrations affect or change the pHe, and rapid clearance from the body hinders the transition of these agents into routine clinical use.
Chemical exchange saturation transfer imaging (CEST) MRI
CEST works by saturating a MRI signal of protons on molecules that exchange with water protons. Then after the saturated proton exchanges to a water molecule, the MRI saturation is transferred to water that will result in a decrease in the water signal. The exchanging molecules can be endogenous or exogenous. CEST experiments using exogenous agents are classified as DIACEST and PARACEST, depending on whether the exogenous agent is either diamagnetic or paramagnetic. The changes in water signal are recorded as an applied radiofrequency pulse at different frequencies (off-resonance from the water signal) known as a Z-spectrum, which provides detection specificity about the exchanging molecules. For CEST MRI to succeed, the chemical shift difference between the water signal and exchange moiety should be more than or equal to the exchange rate. The chemical exchange process depends on many parameters, such as temperature, molecule concentration, pH, redox status, and enzymatic activity [19,31,32]. In the current review, we focus on the use of CEST MRI in measuring in vivo pH.
Endogenous proteins and peptides have exchangeable amide protons that are exploited to measure in vivo pH using CEST, which is known as amide proton transfer (APT) imaging. The amide proton resonances in proteins appear at around 3.5 ppm down field from water and have chemical exchange rate 10-300 s-1. The APT imaging was used to detect acidic pH in ischemic rat brains [33]. pH imaging with APT MRI in acute ischemic tissue correlates well with lactic acid–influenced acidosis and is a promising non-invasive measure [34]. As the pH measured by APT MRI is from the intracellular and extracellular protons, this technique cannot differentiate between extracellular and intracellular pH. However, most proteins are intracellular so that APT MRI is considered to be primarily sensitive to pHi. Unlike ischemia that has the same protein concentration as normal brain tissue, the amide proton concentration may vary in tumors, making it difficult to calculate an accurate pH.
To overcome concentration limitations, a concentration-independent ratiometric technique was developed to measure pH with endogenous CEST MRI, known as amine/amide concentration-independent detection (AACID) [35]. The CEST effect from amides increases with increasing pH and CEST from amine protons decreases with increasing pH, so that AACID values decrease linearly with the increase in pH. To measure pH changes, the amine/amide ratio is expected to be independent of protein concentration and water content. AACID was applied to generate high resolution pH maps in a middle cerebral artery occlusion mouse model, which estimated an average ischemic pH 6.64 ± 0.09 and contralateral tissue pH of 6.97 ± 0.06 [35]. CEST MRI was also used to interrogate U87 glioblastoma multiforme (GBM) tumors treated with lonidamine, which blocks lactate transport and thus increases intracellular acidification [36]. Limitations of this study included the small sample size (n=3), no established calibration of AACID CEST and absolute pH in U87 GBM, and incomplete dissolution of lonidamine. Furthermore, AACID CEST was applied to measure acidification in a GBM mouse model in three independent studies using topiramate (blocks carbonic anhydrase action), dichloroacetate (blocks the action of enzyme pyruvate dehydrogenase kinase), and quercetin (blocks monocarboxylate transporter) [37-39]. Although AACID CEST is a robust method for measuring pH in vivo, it cannot differentiate between pHe and pHi. As a result, it has limited applications and has not been translated to the clinic.
Amine-CEST is based on chemical exchange from amines that is also base-catalyzed, just like amides. Unlike amides, amines exchange protons very quickly and can generate a good CEST signal. When pH decreases, the proton exchange from amines decreases and falls within the ideal exchange rate window for generating CEST signal. A magnetization transfer ratio asymmetry at 3.0 ppm by CEST MRI was used to measure pH-weighted imaging in recurrent GBM patients before and after bevacizumab treatment. Tumor acidity was significantly reduced in the tumor after bevacizumab treatment and the patients who failed bevacizumab showed residual regions or newly emerging localized area acidity in CEST MRI two months prior to recurrence. Tumor acidity measured with this method in contrast enhanced and non-enhanced tumor was linearly correlated with progression-free survival [40]. However, the caveat is that changes in CEST signal not only result from the pH change but also in response to change in protein concentration due to treatment. Rigorous research is critically needed to determine if amine-CEST is truly indicating a change in pH, or if this method is more sensitive to changes in protein concentration in tissues.
Exogenous DIACEST contrast agents can specifically measure pHe or pHi, depending on their spatial presence. Nearly ~10 mM of agent is needed for pHe detection by CEST. These agents have exchangeable amide protons that are 4-9 ppm away from water proton resonance and can be saturated selectively. Most exogenous DIACEST agents that are being studied are clinically approved computed tomography (CT) contrast agents. Iopamidol is a well-known, FDA-approved CT agent that was investigated as a CEST MRI contrast agent because of the availability of three exchangeable amide protons. Iopamidol has been employed to determine pH in healthy kidney and kidney disease models by CEST MRI (Figure 2) [41-44]. The pH values measured after 5 minutes of injection of iopamidol were 7.0 ± 0.11 in renal cortex, 6.85 ± 0.15 in renal medulla, and 6.6 ± 0.20 in renal calyx of healthy mice [41]. A hybrid denoising approach was used to improve the accuracy of in vivo pH imaging with CEST MRI by injected iopamidol [45]. The hybrid denoising method is a combination of the nonlocal mean filter and anisotropic diffusion tensor method [46]. The treatment response to dichloroacetate (blocks the pyruvate-to-lactate conversion) in a breast cancer mouse model was interrogated by measuring pHe with iopamidol DIACEST [47]. After three days following administration of dichloroacetate in mice, the observed pHe was +0.1 ± 0.03 in treated mice and vehicle control mice (intraperitoneal injections of PBS without oral DCA) showed -0.12 ± 0.03 pH. Similarly, pHe differences were +0.004 ± 0.04 and −0.09 ± 0.04 for treated and vehicle control mice respectively 15 days post treatment compared to mice before administration of dichloroacetate or PBS. The data showed that dichloroacetate did not have a significant effect on tumor growth and survival. Iopamidol demonstrated reasonable efficacy in determining pH between 5.5-7.9 [11, 48]. Iopamidol-based acidoCEST was optimized and translated to measure acidosis in patients with metastatic ovarian cancer and the results were compared to those of DCE MRI and histopathology [49]. The right posterior tumor on the patient showed pHe of 6.79 and other tumor sites showed pHe of ~6.4. Since iopamidol is already used in the clinic for CT scans, exploring the use of this agent for acidoCEST measurements in the clinic is comparatively easy. Nonetheless, this is an important step in translating this technology to routine clinical use.
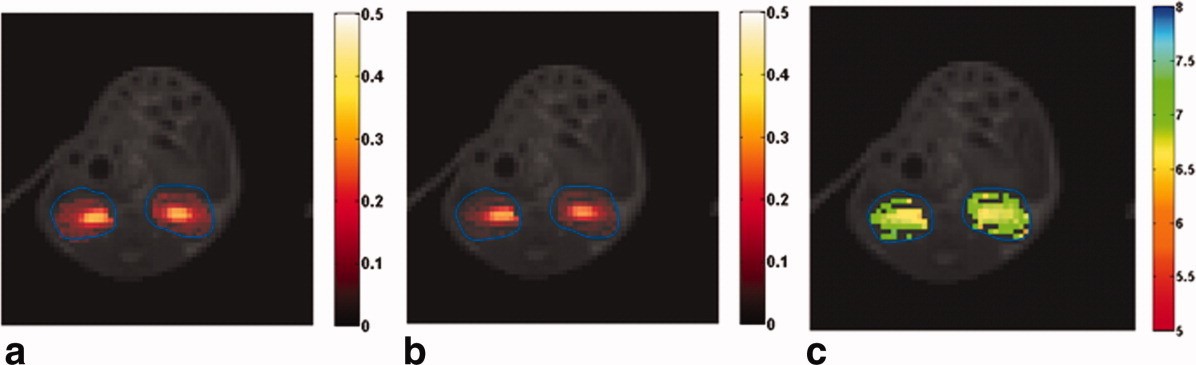
Figure 2: Adapted with permission from Longo DL, et al. [41]. After the intravenous injection of 0.75 mg of iopamidol I/g b.w. bolus saturation transfer maps were obtained by irradiating the 4.2 ppm (a) and 5.5 ppm (b) amide proton pools, respectively. (c) A pH map was obtained by employing a ratiometric approach with the saturation transfer values shown in (a) and (b). The obtained saturation transfer values and pH maps were superimposed on the anatomical proton image.
Iopromide is another x-ray contrast agent that has been used to perform pH imaging by CEST MRI because of the presence of mobile amide protons which transfer saturation to bulk water by amide proton exchange [50]. Iopromide has been used to produce pixel-wise tumor pHe maps in MCF-7 and MDA-MB-231 mouse models [51]. The CEST effects were measured at 4.2 and 5.6 ppm relative to water chemical shift at 0 ppm. The pHe measured by iopromide CEST MRI were similar to the microsensor pHe measurements. A comparative study of CEST MRI with iopamidol and iopromide in the MCF-7 mouse model showed that iopamidol can produce a more precise pHe measurement [52]. Iopamidol has two equivalent protons resonating at 4.2 ppm, while iopromide has only proton at this resonance frequency so that iopamidol generates a stronger CEST signal.
Iobitridol is another CEST MRI agent that has been adopted from CT contrast agents. This agent has one exchangeable proton, which appears at 5.2 ppm in the proton NMR spectrum when water signal is referenced to 0 ppm. The measured kex of iobitridol at pH 5.5, 6.0, 6.3, 6.7, and 7.0 were 265, 550, 1481, 2640, and 4820 s-1. A ratiometric approach was applied to iobitridol to calculate the pH, where a single exchangeable proton is irradiated with a radiofrequency pulse of two different powers to generate two CEST contrasts. The ratio of these two CEST signals was used to obtain concentration-independent pH maps [53].
Iodixanol and imidazole-4-5-dicarboxamides (I45DCs) are two other contrast agents that were explored to measure pHe in vivo [54, 55]. I45DCs have an exchangeable proton that resonates at the 7.8 ppm from water. As this is far away from the water proton resonance, it is free from interference from saturation radiofrequency irradiation of the water proton. The I45DCs was used to measure the pH in mouse kidneys. The agent was injected via tail vein, pH maps were obtained 45 minutes post injection and the average pH of kidney was found to be 6.5 ± 0.1 (n = 3) [54]. An advantage of these agents for use in measurements of pHe is that they do not act as buffers as they have pKa >10 due to amides. As a disadvantage the kex value of ~4000 -1s is not ideal relative to chemical shift of 7.8 ppm for 3T scanners.
PARACEST agents are lanthanide containing complexes (Ln=Eu, Dy, Ho, Er, Tm, and Yb) or other metallo-complexes (Zn, Co, Ni, Fe, etc.). These PARACEST agents have shown promise in measuring pH in vivo. Coordinated water molecules, or the exchangeable proton that is attached to a functional group of the coordinated molecule, can generate a CEST contrast signal [11, 56]. The large chemical shift difference between the water signal and exchangeable proton on the lanthanide complex and suitable exchange rates (kex < δw (chemical shift difference)) have made them as attractive CEST MRI agents.
The DOTAM-Gly ligand, which coordinates with different lanthanides (Ln=Eu, Dy, Ho, Er, Tm, and Yb), has been tested for CEST MRI-based pH measurements. The Yb‐DOTAM‐Gly complex displayed excellent CEST contrast properties and can efficiently probe pH between the 5.5-8.1 range [57]. However, the precision of pH measurements depends on knowledge of the absolute concentrations of the paramagnetic agent. To overcome these concentration-dependent measurements, a ratiometric method was used with two paramagnetic complex mixtures of Eu‐DOTAM‐Gly and Yb‐DOTAM‐Gly. The pH-dependent CEST contrast was generated using the ratio of the concentration of injected paramagnetic complex mixtures [57]. However, the injection of double-contrast agents to generate concentration-independent pH measurements is not an ideal approach because of potentially differing pharmacokinetics and biological distributions of agents.
The ytterbium complex Yb+3-HPDO3A is another PARACEST agent that generates two CEST signals in solution (77 and 91 ppm) because of the presence of two pH-dependent diastereomers. The ratiometric method is used to calculate pH, which is independent of concentration [58]. The pH maps in melanoma tumors in mice were reported using this Yb+3-HPDO3A MRI CEST agent and showed excellent pH sensitivity between pH 6.5-8.0 [59]. Recently, pH maps were correlated with tumor aggressiveness in a glioma rat model with Yb+3-HPDO3A [60]. Another ytterbium complex, Yb3+-1,4,7,10-tetraazacyclododecane-1,4,7-triacetic acid,10-o-aminoanilide (Yb-DO3A-oAA), was reported as a pH-dependent CEST contrast agent in which two water-exchangeable protons are present on an amide and aryl amine [61]. The aryl amine forms a hydrogen bond with the carboxylate group in the complex, allowing the generation of CEST effects from the amine (slowing down the fast exchange).
The agent Yb-DO3A-oAA was employed to generate pHe maps in a MCF-7 carcinoma mouse model. A terbium-based Tb3+ contrast agent was also used to generate pHe maps by the CEST effect; the CEST resonance signal was -550 ppm, far beyond the normal magnetization transfer window (between -100 to +100). The exchangeable water (coordinated water ligand in complex, which is in bound form) changes its chemical shift as the pH changes (sensitive between pH 5-8)[62]. A europium-based complex–CEST agent was shown to have a pH-dependent chemical shift in CEST resonance that was used to generate a pH map in the kidneys of healthy mice [63]. In another approach, non-exchangeable proton shifts in macrocyclic chelates of lanthanide complexes are evaluated to generate pHe maps using biosensor imaging of redundant deviations in shifts, known as BIRDS [64-67].
The major drawback to exploring non-exchangeable proton chelate complexes is that they are rapidly cleared by the kidneys before they accumulate in the tumor, and they require high–magnetic field spectrometers to separate the resonances. Another set of CEST agent known as nanoparticle-based agents consists of lanthanide complexes are entrapped in self-assembling liposomes. Interior water protons in the liposome exchange with exterior bulk water. The chemical shift of the interior water is shifted from the exterior water by lanthanide chelates inside the liposome. Saturation of interior water signal and water exchange from inside to outside the liposome translates the saturation to bulk water to produce CEST contrast [68-70]. PARACEST agents are more efficient than diamagnetic CEST agents in terms of the large chemical shift difference between water signal and exchangeable protons. However, large dosages are required to introduce a feasible amount of contrast into the tumor (target tissue), and feasible higher power levels for a good saturation effect with fast exchangeable protons, hindering the transfer of this method to routine clinical use.
The metal complexes of Co(II), Fe(II), and Ni(II) also have been employed to measure the pH by CEST MRI. These metal complexes have 7,13-bis(carbamoylmethyl)-1,4,10-trioxa-7,13-diazacyclopentadecane (L) as one of the ligands [71-73]. The metal complexes of Co(II) and Fe(II) with macromolecule ligand L, Co(L)]Cl2·2H2O and [Fe(L)](CF3SO3)2 form distorted pentagonal bipyramidal geometry and [Ni(L)](CF3SO3)2·H2O forms distorted octahedral geometry. The CEST resonances of [Co(L)]2+, [Ni(L)]2+, and [Fe(L)]2+ resonate at 59, 72, and 92 ppm respectively away from bulk water. The CEST effect of all the three complexes in biological media, rabbit serum, egg white or agarose gel, increased with pH in the range of 6.5 to 7.7. The disadvantages are that the Ni complex reacts with the albumin in the biological media and broadened resonances of the Co(II) protons due to larger proton exchange rates [71]. Also potential instability of the paramagnetic redox state of metallo-complexes has hindered clinical translation.
Hyperpolarized magnetic resonance spectroscopic imaging
Hyperpolarization is a process in which nuclear spins are temporarily aligned in the direction of the magnetic field, thereby increasing the signal 10,000 to 100,000 fold compared to the signal at thermal equilibrium. Many methods of hyperpolarization were invented to hyperpolarize a range of metabolites, substrates, and agents [74]. In this review, we discuss the application of hyperpolarized agents in measuring pH in vivo.
Hyperpolarized (HP) 13C-bicarbonate was injected into a lymphoma mouse model to estimate pHi in vivo. The ratio of intensities of 13C bicarbonate (H13CO3–) at 161 ppm and 13C carbon dioxide (13CO2) at 125 ppm was used to calculate the pH in vivo from the Henderson-Hasselbalch equation with the assumption that pKa is known in vivo [75]. HP-13C bicarbonate was injected into two groups of mice bearing murine lymphoma tumors that were treated with ammonium chloride and sodium bicarbonate. The pH of mice on sodium bicarbonate treatment showed an increase in pH to 7.02 ± 0.04 (n=5) whereas mice on ammonium chloride treatment showed decreased tumor pH to 6.47 ± 0.11. The in vivo pH measurements obtained with injected HP-13C bicarbonate and converted 13C-carbon dioxide ratio were in close agreement with measurements made by 31P MRS with the agent 3-aminopropylphosphonate (3-APP). The same technique was used to measure the in vivo pH before and immediately after ischemia in rat hearts. The only difference was that HP-13C pyruvate was injected instead of HP-13C bicarbonate [76]. The chemical reaction-induced multi-molecular polarization method was used to produce CO2 and HCO3– from the chemical reaction of 1, 2-13C labeled pyruvate and H2O2. In this method, the signal ratios of CO2 and HCO3– are used to calculate pH using the Henderson-Hasselbalch equation [77]. The main limitations of using HP-13C bicarbonate to measure pH are its short longitudinal relaxation time (T1) (~10 sec) and small differences in the rate of depolarization of H13CO2 and 13CO2 will lead to varying pH with time. The required high concentration of bicarbonate to obtain pH information may change the pH of the environment leading to an error in measured in vivo pH.
Other hyperpolarized agents have been employed for measuring tumor pH. In another study, Good’s buffer, N-(2-acetamido)-2-aminoethanesulfonic acid, was used to measure pH with hyperpolarized 13C-MRS [78]. More recently, hyperpolarized l3C-labeled zymonic acid (ZA) was demonstrated to be a reliable pH imaging agent in vivo. The zymonic acid (ZA) resonances shift 3.0 ppm per pH unit in the physiological pH range and this agent is non-toxic (Figure 3) [79]. The pH measured from zymonic acid is predominantly from the extracellular space. The pHe of rat MAT B III adenocarcinoma in vivo was measured with hyperpolarized 13C zymonic acid and was 6.94 ± 0.12 in one of the tumor compartments, and another tumor compartment was pHe 7.40 ± 0.05 attributed to vasculature of the tumor, because a pHe of 7.39 ± 0.05 was observed in the blood near the vena cava. The results obtained were in close agreement with the independent pH measurement obtained using microelectrodes and 31P 3-APP MRS. The advantages of using zymonic acid as a pH sensor is that it is independent of temperature, concentration, ionic strength, and protein concentration. However, there will be bias in pHe measurement because there is a presence of a small amount of intracellular zymonic acid in the system in vivo. Another compound, (Z)-4-methyl-2-oxopent-3-enedioic acid (Z-OMPD), which is structurally similar to zymonic acid, showed promise as a hyperpolarized pH imaging agent. This compound has a T1 of 28 ±1 sec, hyperpolarization of ~26% and a relatively wide range (~3 ppm per unit pH in the physiological pH range of 6-8) of downfield chemical shift change on hyperpolarized carbon-5 resonance with an increase in pH. This agent has been employed to measure the pHe of healthy rat kidneys in vivo [80]. However, further studies are needed to estimate the errors due to internalization in the cell, temperature, ionic strength, and pharmacokinetics and to evaluate its potential to measure pH in tumor in vivo.
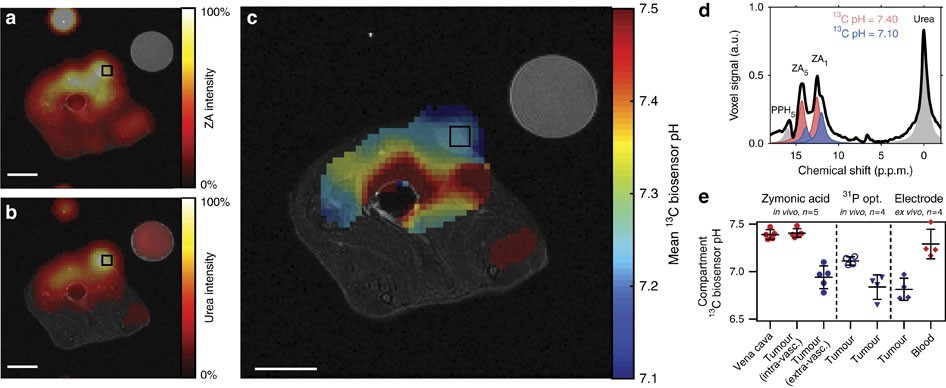
Figure 3: Adapted with permission from Düwel S, et al. [79]. An axial slice of a hyperpolarized 13C measurement (colored) is overlaid on anatomical proton images (greyscale). The catheter used for injection and a calibration or reference phantom containing 13C urea is visible in the image. Both (a) zymonic acid (ZA) and (b) urea accumulated in the MAT B III tumor. (c) The tumor showed a lower mean pH value compared to that in the surrounding tissue on a pH map. Intensity windows are based on sufficiently high signal levels for either (intensity images) or both (pH images) ZA and urea for all 13C images. Spectra from selected tumor voxels of representative animals (d) are best fitted with two pairs of ZA resonances (red, blue). e) pH values in the tumors consistently differed compared to those in the vena cava (n=5 and mean±s.d.) and to three interstitial and pHe measurements of four additional animals, according to in vivo 31P MRS by 3-APP and in vivo and an ex vivo pH measurements of tissue using a needle-type optical sensor electrode. Scale bars, 1 cm.
MRI methods based on T1 and T2 relaxation
Interactions between the 1H MR spin and the surrounding “lattice” allow an excited 1H MR spin to relax to equilibrium at a T1 relaxation rate time constant [81]. In addition, interactions between an excited 1H MR spin and another MR spin cause a loss of detectable MR signal at a T2 relaxation time constant. MRI contrast agents can accelerate these T1 and T2 relaxation times (in units of sec), based on the intrinsic r1 and r2 relaxivities of the agents (in units of mM-1sec-1). The endogenous T1 and T2 times can be measured for a tissue without agent, then T1– and T2-weighted MR images can be acquired of the tissue after agent administration to estimate the T1 or T2 time with agent, and these images can be combined with the r1 or r2 relaxivity to determine the concentration of the agent (in units of mM; Equations 1a and 1b). 
Where [agent] is the concentration of the agent
Many T1 and T2-based MRI contrast agents have r1 or r2 relaxivities that are dependent on pH [82,83]. The pH-dependent T1 agents typically have a ligand that shields a metal ion at high pH, and protonation of this ligand at lower pH causes the ligand to dissociate from the metal ion and expose the metal ion to water, increasing r1 relaxivity of the agent. Alternatively, some pH-dependent T1 and T2 agents are designed to aggregate in a pH-dependent manner, causing a change in tumbling time or superparamagnetism of the aggregation, thereby increasing r1 or r2 relaxivities of the agent.
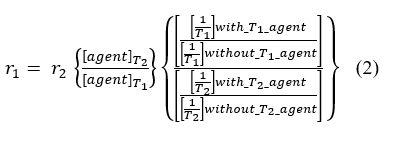
Unfortunately, the change in T1 or T2 relaxation times is also dependent on the concentration of the MRI contrast agent (Equation 1). The two “unknowns” of pH and concentration cannot be solved with only one “known” of the measured change in T1 or T2 [84]. To address this fundamental problem, a T1 agent that has a pH-dependent r1 relaxivity has been combined with a T2 agent that has a r2 relaxivity which is independent of pH [85]. In theory, T2-weighted MR images can then be used to estimate the concentration of the T2-based agent, and T1-weighted MR images can then be used to measure the r1 relaxivity of the T1-based agent (Equation 2). This process assumes that the ratio of the two agents is known, which is a good assumption when two agents are co-administered in vivo and have identical pharmacokinetic delivery to the tumor. This r1 relaxivity can then be used to estimate pHe by using an r1-pH calibration that has been established with chemical samples.
In practice, this process with T1– and T2-based MRI contrast agents can produce inaccurate estimates of in vivo pHe due to T1 and T2 “cross-talk” between the agents. The pH-dependent agent may have a pH-dependent r2 relaxivity in addition to a pH-dependent r1, altering the T2-weighted MR images that are used to evaluate the pH-independent agent. Similarly, the pH-independent agent may have a r1 relaxivity that alters the T1-wighted MR images that are used to assess the pH-dependent agent. This process can also result in imprecise determinations of pHe due to error propagation. The measurement of T1 relaxation time often has ~10% standard deviation during in vivo studies, and T2 relaxation time measurements often have even worse standard deviation greater than 20%. Combining these two imprecise measurements leads to very imprecise pHe estimates.
Simultaneous PET/MRI
To address this pitfall with T1/T2 MRI co-agents, PET/MRI co-agents have been developed for measuring pHe [86]. In this approach, the pH-independent, T2-based MRI contrast agent is replaced with a radiolabeled version of the T1-based MRI contrast agent (the radioactivity of the PET agent is fundamentally independent of pH). This radiolabeled PET agent is doped into the sample of the T1-based MRI agent at ~10-5 lower concentration, at a known ratio of MRI agent concentration (in units of mM) to PET radioactivity (in units of mCi). When the PET/MRI co-agents are administered in vivo, PET imaging is used to measure the radioactivity in the tumor; the known mM-to-mCi ratio is used to convert the radioactivity of the PET agent to the concentration of the MRI co-agent; and MR imaging is used to measure the T1 relaxation time before and after agent administration (Figure 4) [87]. Then Equation 1a is used to determine r1, which can be used to estimate pHe by using the r1-pH calibration previously established with chemical samples.
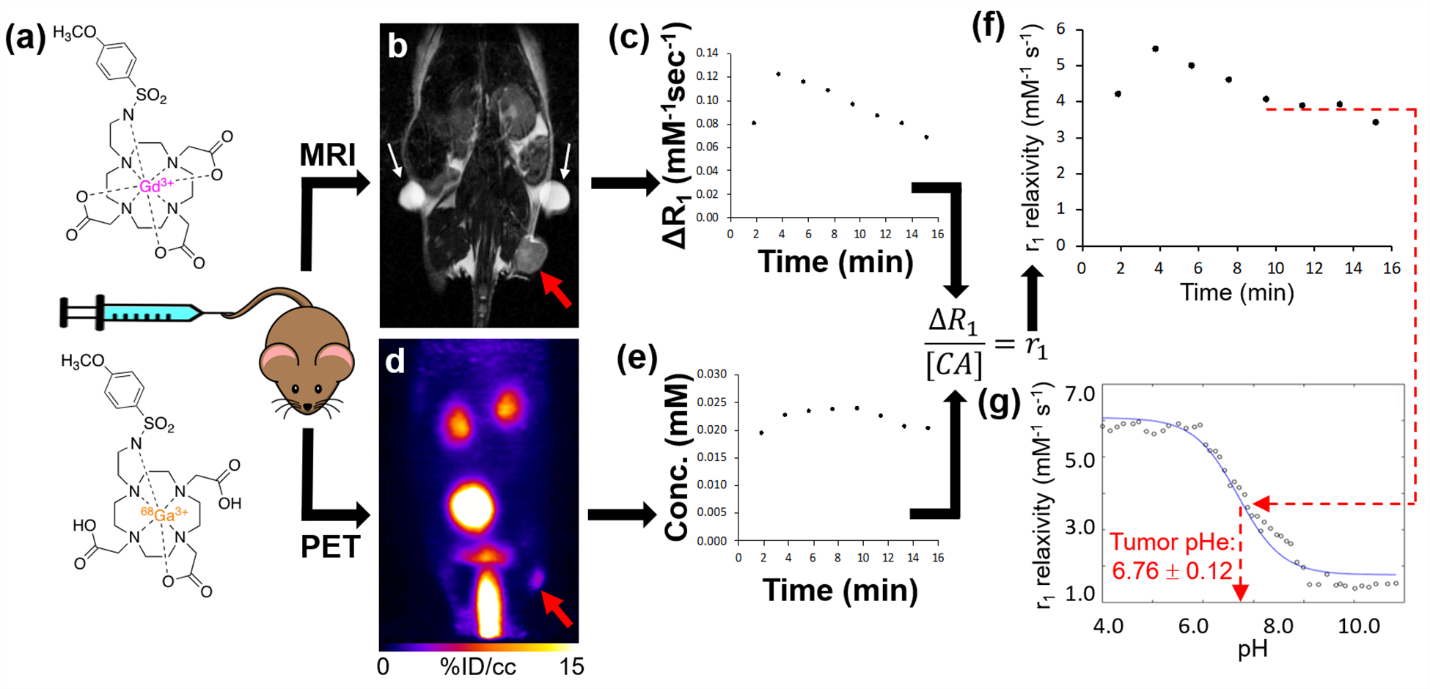
Figure 4: Adapted from ref. Pollard AC, et al. [87]. In vivo tumor pHe measured by PET/MRI. a) A single intravenous injection of the PET and MRI co-agents injected into a subcutaneous flank tumor model of MIA Pa-Ca2 pancreatic cancer and simultaneous PET/MRI was acquired. b) A baseline anatomical MR image and T1 map were obtained prior to injection of agents. The tumor and fiducial markers are highlighted in a red arrow and white arrows respectively. c) After 1 minute of start of DCE MRI scan, a known ratio of co-agents were simultaneously injected i.v. The change in relaxation rate (ΔR1) was determined from the MR images. d) A dynamic PET scan was obtained simultaneously with the DCE MRI scan post-injection. e) The PET images obtained via the known injected ratio of the two agents were used to determine the dynamic concentration of the MRI co-agent. f) The concentration values and ΔR1 were used to calculate r1 relaxivities in two-minute time frames during the dynamic PET/MRI scan. g) Once the curve reached a steady value after 8 minutes post-injection, the average r1 relaxivity was compared with the pH-relaxivity calibration to estimate in vivo tumor pHe.
A simultaneous PET/MRI instrument is required to detect the pair of PET and MRI co-agents that are administered in vivo. Importantly, the PET and MRI components of this hybrid system can be carefully calibrated and validated to ensure that there is no “cross-talk” between the PET and MRI components of the system, which removes one of the pitfalls of the T1/T2 MRI co-agent approach for measuring pHe [88]. Furthermore, the PET measurements are very accurate and precise, greatly reducing error propagation with two imaging measurements that plagues the pHe measurements with T1/T2 MRI co-agents. Preliminary studies have indicated that the precision of the pHe measurement with simultaneous PET/MRI can be improved by further improving the precision of the T1-based MRI measurements. As with the MRI co-agents, the pHe measurements with simultaneous PET/MRI assumes that the in vivo pharmacokinetics of the PET and MRI co-agents are identical. Research efforts are ongoing to optimize the pharmacokinetics of the PET/MRI co-agents and establish simultaneous PET/MRI as a new paradigm for measuring tumor pHe.
Limitations and Future Direction
The measurement of in vivo pH is important, as many diseases are associated with changes in pHi and pHe. Understanding in vivo pH also helps in treatment planning, as many drugs fail in acidic environments [89]. The limitations of in vivo pH measurement by MRI of exogeneous contrast agents are its low sensitivity, toxicity, and accuracy. Disadvantages of endogenous contrast agents are low sensitivity due to low concentration and inaccuracy in pH measurement due to combined measurement of pHi and pHe. In vivo pH imaging will be improved with new extracellular and intracellular contrast agents, technology advancements, and acquisition and processing methods.
Acknowledgements
The ‘Editing Services, Research Medical Library’ is acknowledged for scientific English editing services.
Funding
This work was supported by the Cancer Prevention and Research Institute of Texas (grant RP220270 to P. K. B.), the National Institute of Biomedical Imaging and Engineering (grant R21EB031217 to P. K. B.), MD Anderson Institutional Research Grants and Startup Funds (to P. K. B. and M. D. P), a Computational Cancer Biology Training Program postdoctoral fellowship (Cancer Prevention and Research Institute of Texas grant RP170593 to (S. P.) National Institutes of Health through grant R01 CA231513 and the Texas CPRIT program through grant RP220270 (M. D. P).
References
- Raghunand N (2006) Tissue pH measurement by magnetic resonance spectroscopy and imaging. Magn Reson Imag. Methods and Biologic Applications, Prasad, P. V., Ed. Humana Press: Totowa, NJ, 347-364.
- Korostynska O, Arshak K, Gill E, Arshak A (2007) Materials and techniques for in vivo pH monitoring. IEEE Sens J8: 20-28.
- Hoult DI, Busby SJW, Gadian DG, Radda GK, Richards RE, et al. (1974) Observation of tissue metabolites using 31P nuclear magnetic resonance. Nature 252: 285-287.
- RobertsJKM, Wade-Jardetzky N, Jardetsky O (1981) Intracellular pH measurements by phosphorus-31 nuclear magnetic resonance. Influence of factors other than pH on phosphorus-31 chemical shifts. Biochemistry 20(19):5389-5394.
- Garlick PB, Radda GK, Seeley PJ (1979) Studies of acidosis in the ischaemic heart by phosphorus nuclear magnetic resonance. Biochem J 184(3):547-554.
- Ross BD, Radda GK, Gadian DG, Rocker G, Esiri M, et al. (1981) Examination of a Case of Suspected McArdle’s Syndrome by 31P Nuclear Magnetic Resonance. New Engl J Med 304(22): 1338-1342.
- Oberhaensli R, Bore P, Rampling R, Hilton-Jones D, Hands L, et al. (1986) Biochemical investigation of human tumours in vivo with phosphorus-31 magnetic resonance spectroscopy. Lancet 328 (8497): 8-11.
- Cichocka M, Kozub J, Urbanik A(2015) pH measurements of the brain using phosphorus magnetic resonance spectroscopy (31PMRS) in healthy men–comparison of two analysis methods. Pol J Radiol 80:509-514.
- Gillies RJ, Liu Z, Bhujwalla Z (1994) 31P-MRS measurements of extracellular pH of tumors using 3-aminopropylphosphonate. Am J Physiol Cell Physiol 267(1): C195-C203.
- Bhujwalla ZM, McCoy CL, Glickson JD, Gillies RJ, Stubbs M (1998) Estimations of intra- and extracellular volume and pH by 31P magnetic resonance spectroscopy: effect of therapy on RIF-1 tumours. Br J Cancer 78(5): 606-611.
- Anemone A, Consolino L, Arena F, Capozza M, Longo DL (2019) Imaging tumor acidosis: a survey of the available techniques for mapping in vivo tumor pH. Cancer Metastasis Rev 1-25.
- Fisher MJ, Dillon PF (1987) Phenylphosphonate: a 31P-NMR indicator of extracellular pH and volume in the isolated perfused rabbit bladder. Circ Res 60(4): 472-477.
- Meyer RA, Brown TR, Kushmerick MJ (1985) Phosphorus nuclear magnetic resonance of fast-and slow-twitch muscle. Am J Physiol Cell Physiol 248(3):C279-C287.
- Yu JX, Hallac RR, Chiguru S, Mason RP (2013) New frontiers and developing applications in 19F NMR. Prog Nucl Magn Reson Spectrosc 70:25-49.
- Deutsch C, Taylor JS, Wilson DF (1982) Regulation of intracellular pH by human peripheral blood lymphocytes as measured by 19F NMR. Proc Natl Acad Sci USA 79(24): 7944-7948.
- Beech JS, Iles RA (1991) Hepatic intracellular pH in vivo using F-quene 1 and 19F NMR spectroscopy. Magn Reson Med 19(2): 386-392.
- Taylor J, Deutsch C (1988) 19F-nuclear magnetic resonance: measurements of [O2] and pH in biological systems. Biophys J 53(2): 227-233.
- Yu JX, Cui W, Bourke VA., Mason RP (2012) 6-Trifluoromethylpyridoxine: novel (19)F NMR pH indicator for in vivo detection. J Med Chem 55 (15): 6814-21.
- Janasik D, Jasiński K, Węglarz WP, Nemec I., Jewula P et al. (2022) Ratiometric pH-responsive 19Fmagnetic resonance imaging contrast agents based on hydrazone switches. Anal Chem 94 (8): 3427-3431.
- Anemone A, Consolino L, Arena F, Capozza M, Longo DL (2019) Imaging tumor acidosis: a survey of the available techniques for mapping in vivo tumor pH. Cancer Metastasis Rev 38(1): 25-49.
- Rudkin TM, Arnold DL (1999) Proton magnetic resonance spectroscopy for the diagnosis and management of cerebral disorders. Arch Neurol 56(8): 919-926.
- Magierski R, Sobow T (2014) Magnetic resonance spectroscopy in the diagnosis of dementia with lewy bodies. Biomed Res Int 2014: 809503-809509.
- Faghihi R, Zeinali-RB, Mosleh-Shirazi MA, Saeedi-Moghadam M, Lotfi M et al. (2017) Magnetic resonance spectroscopy and its clinical applications: a review. J Med Imaging Radiat Sci 48 (3): 233-253.
- Rabenstein DL, Isab AA (1982) Determination of the intracellular pH of intact erythrocytes by 1H NMR spectroscopy. Anal Biochem 121 (2): 423-432.
- Pan JW, Hamm JR, Rothman DL, Shulman RG (1988) Intracellular pH in human skeletal muscle by 1H NMR. Proc Natl Acad Sci USA 85(21): 7836-7839.
- van Sluis R, Bhujwalla ZM, Raghunand N, Ballesteros P, Alvarez J et al. (1999) In vivo imaging of extracellular pH using 1H MRSI. Magn Reson Med 41(4):743-750.
- García-Martín ML, Hérigault G, Rémy C, Farion R, Ballesteros P et al. (2001) Mapping extracellular pH in rat brain gliomas in vivo by 1H magnetic resonance spectroscopic Imaging: Comparison with maps of metabolites. Cancer Res 61 (17): 6524-6531.
- Provent P, Benito M, Hiba B, Farion R, López-Larrubia P et al. (2007) Serial in vivo spectroscopic nuclear magnetic resonance imaging of lactate and extracellular pH in rat gliomas shows redistribution of protons away from sites of Gglycolysis. Cancer Res 67(16): 7638-7645.
- Lee SH, McIntyre D, Honess D, Hulikova A, Pacheco-Torres J et al. (2018) Carbonic anhydrase IX is a pH-stat that sets an acidic tumour extracellular pH in vivo. Br J Cancer 119(5): 622-630.
- Cohen JS, Motiei M, Carmi S, Shiperto D, Yefet O (2004) Determination of intracellular pH and compartmentation using diffusion-weighted NMR spectroscopy with pH-sensitive indicators. Magn Reson Med 51(5):900-903.
- Vinogradov E, Sherry AD, Lenkinski RE (2013) CEST: from basic principles to applications, challenges and opportunities. J Magn Reson 229: 155-172.
- Liu G, Song X, Chan KW, McMahon MT (2013) Nuts and bolts of chemical exchange saturation transfer MRI. NMR Biomed 26 (7): 810-828.
- Zhou J, Payen JF, Wilson DA, Traystman RJ, van Zijl PCM (2003) Using the amide proton signals of intracellular proteins and peptides to detect pH effects in MRI. Nat Med 9 (8): 1085-1090.
- Sun PZ, Cheung JS, Wang E, Lo EH (2011) Association between pH-Weighted Endogenous Amide Proton Chemical Exchange Saturation Transfer MRI and Tissue Lactic Acidosis during Acute Ischemic Stroke. J Cereb Blood Flow Metab 31(8): 1743-1750.
- McVicar N, Li AX, Gonçalves DF, Bellyou M, Meakin SO et al. (2014) Quantitative tissue pH measurement during cerebral ischemia using amine and amide concentration-independent detection (AACID) with MRI. J Cereb Blood Flow Metab 34 (4): 690-698.
- McVicar N, Li AX, Meakin SO, Bartha R (2015) Imaging chemical exchange saturation transfer (CEST) effects following tumor-selective acidification using lonidamine. NMR Biomed 28 (5): 566-575.
- Marathe K, McVicar N, Li A, Bellyou M, Meakin S, et al. (2016) Topiramate induces acute intracellular acidification in glioblastoma. J Neuro Oncol 130 (3): 465-472.
- Albatany M., Li A, Meakin S, Bartha R (2018) Dichloroacetate induced intracellular acidification in glioblastoma: in vivo detection using AACID-CEST MRI at 9.4 Tesla. J Neuro-oncol 136 (2): 255-262.
- Albatany M, Meakin S, Bartha R (2019) The Monocarboxylate transporter inhibitor Quercetin induces intracellular acidification in a mouse model of Glioblastoma Multiforme: in-vivo detection using magnetic resonance imaging. Invest New Drugs 37 (4): 595-601.
- Yao J, Tan CHP, Schlossman J, Chakhoyan A, Raymond C, et al. (2019) pH-weighted amine chemical exchange saturation transfer echoplanar imaging (CEST-EPI) as a potential early biomarker for bevacizumab failure in recurrent glioblastoma. J Neuro-oncol 142 (3): 587-595.
- Longo DL, Dastrù W, Digilio G, Keupp J, Langereis S et al. (2011) Iopamidol as a responsive MRI-chemical exchange saturation transfer contrast agent for pH mapping of kidneys: In vivo studies in mice at 7 T. Magn Reson Med 65 (1): 202-211.
- Pavuluri K, Manoli I, Pass A, Li Y, Vernon HJ et al. (2019) Noninvasive monitoring of chronic kidney disease using pH and perfusion imaging. Sci Advan 5 (8): eaaw8357.
- Longo DL, Busato A, Lanzardo S, Antico F, Aime S (2013) Imaging the pH evolution of an acute kidney injury model by means of iopamidol, a MRI‐CEST pH‐responsive contrast agent. Magn Reson Med 70 (3): 859-864.
- Longo DL, Cutrin JC, Michelotti F, Irrera P, Aime S (2017) Noninvasive evaluation of renal pH homeostasis after ischemia reperfusion injury by CEST-MRI. NMR Biomed 30 (7): e3720.
- Romdhane F, Villano D, Irrera P, Consolino L, LongoDL (2021) Evaluation of a similarity anisotropic diffusion denoising approach for improving in vivo CEST-MRI tumor pH imaging. Magn Reson Med 85 (6): 3479-3496.
- Wiest-Daesslé N, Prima S, Coupé P, Morrissey SP, Barillot C (2007) Non-local means variants for denoising of diffusion-weighted and diffusion tensor MRI. Med Image Comput Comput Assist Interv 10 (Pt 2), 344-351.
- Anemone A, Consolino L, Conti L, Reineri F, Cavallo F et al. (2017) In vivo evaluation of tumour acidosis for assessing the early metabolic response and onset of resistance to dichloroacetate by using magnetic resonance pH imaging. Int J Oncol 51 (2): 498-506.
- Longo DL, Dastrù W, Digilio G, Keupp J, Langereis S et al. (2011) Iopamidol as a responsive MRI‐chemical exchange saturation transfer contrast agent for pH mapping of kidneys: in vivo studies in mice at 7 T. Magn Reson Med 65 (1): 202-211.
- Jones KM, Randtke EA, Yoshimaru ES, Howison CM, Chalasani P et al. (2017) Clinical translation of tumor acidosis measurements with acidoCEST MRI. Mol Imaging Biol 19 (4), 617-625.
- Chen LQ, Howison CM, Jeffery JJ, Robey IF, Kuo PH et al. (2014) Evaluations of extracellular pH within in vivo tumors using acidoCEST MRI. Magn Reson Med 72(5):1408-1417.
- Chen LQ, Randtke EA, Jones KM, Moon BF, Howison CM et al. (2015) Evaluations of tumor acidosis within in vivo tumor models using parametric maps generated with acidoCEST MRI Mol Imaging Biol 17 (4): 488-496.
- Moon BF, Jones KM, Chen LQ, Liu P, Randtke EA et al. (2015) A comparison of iopromide and iopamidol, two acidoCEST MRI contrast media that measure tumor extracellular pH. Contrast Media Mol Imaging 10 (6): 446-455.
- Longo DL, Sun PZ, Consolino L, Michelotti FC, Uggeri F et al. (2014) A general MRI-CEST ratiometric approach for pH imaging: demonstration of in vivo pH mapping with iobitridol. J Am Chem Soc 136 (41): 14333-14336.
- Arena F, Irrera P, Consolino L, Serra SC, Zaiss M et al. (2018) Flip-angle based ratiometric approach for pulsed CEST-MRI pH imaging. J Magn Reson 287: 1-9.
- Yang X, Song X, Ray Banerjee S, Li Y, Byun Y et al. (2016) Developing imidazoles as CEST MRI pH sensors. Contrast Media Mol Imaging 11(4): 304-312.
- Sherry AD, Wu Y (2013) The importance of water exchange rates in the design of responsive agents for MRI. Curr Opin Chem Biol 17(2):167-174.
- Aime S, Barge A, Delli Castelli D, Fedeli F, Mortillaro A et al. (2002) Paramagnetic Lanthanide(III) complexes as pH-sensitive chemical exchange saturation transfer (CEST) contrast agents for MRI applications. Magn Reson Med 47(4): 639-648.
- Delli Castelli D, Terreno E, Aime S (2011) Yb(III)‐HPDO3A: a dual pH‐and temperature‐responsive CEST agent. Angew Chem Int Ed 50 (8):1798-1800.
- Delli Castelli D, Ferrauto G, Cutrin JC, Terreno E, Aime S (2014) In vivo maps of extracellular pH in murine melanoma by CEST–MRI. Magn Reson Med 71 (1): 326-332.
- Ferrauto G, Di Gregorio E, Auboiroux V, Petit M, Berger F et al. (2018) CEST‐MRI for glioma pH quantification in mouse model: Validation by immunohistochemistry. NMR Biomed 31 (11): e4005.
- Liu G, Li Y, Sheth VR, Pagel MD et al. (2012) Imaging in vivo extracellular pH with a single paramagnetic chemical exchange saturation transfer magnetic resonance imaging contrast agent. Mol Imaging 11 (1): 47-57.
- Wang X, Wu Y, Soesbe TC, Yu J, Zhao P et al. (2015) A pH-Responsive MRI Agent that Can Be Activated Beyond the Tissue Magnetization Transfer Window. Angew Chem Int Ed 54 (30): 8662-8664.
- Wu Y, Zhang S, Soesbe TC, Yu J, Vinogradov E et al. (2016) pH imaging of mouse kidneys in vivo using a frequency-dependent paraCEST agent. Magn Reson Med 75 (6): 2432-2441.
- Coman D, Kiefer GE, Rothman DL, Sherry AD, Hyder F (2011) A lanthanide complex with dual biosensing properties: CEST (chemical exchange saturation transfer) and BIRDS (biosensor imaging of redundant deviation in shifts) with europium DOTA–tetraglycinate. NMR Biomed 24 (10): 1216-1225.
- Aime S, Botta M, Milone L, Terreno E (1996) Paramagnetic complexes as novel NMR pH indicators. Chem Commun 11: 1265-1266.
- Huang Y, Coman D, Ali MM, Hyder F (2015) Lanthanide ion (III) complexes of 1, 4, 7, 10‐tetraazacyclododecane‐1, 4, 7, 10‐tetraaminophosphonate for dual biosensing of pH with chemical exchange saturation transfer (CEST) and biosensor imaging of redundant deviation in shifts (BIRDS). Contrast Media Mol Imaging 10(1): 51-58.
- Coman D, Huang Y, Rao JU, De Feyter HM, Rothman DL (2016) Imaging the intratumoral–peritumoral extracellular pH gradient of gliomas. NMR Biomed 29 (3): 309-319.
- Zhao JM, Har-el Yah-el, McMahon MT, Zhou J, Sherry AD et al. (2008) Size-Induced Enhancement of Chemical Exchange Saturation Transfer (CEST) Contrast in Liposomes. J Am Chem Soc 130 (15), 5178-5184.
- Aime S, Delli Castelli D, Terreno E (2005) Highly Sensitive MRI Chemical Exchange Saturation Transfer Agents Using Liposomes. Angew Chem Int Ed 44 (34): 5513-5515.
- McMahon MT, Chan KWY (2014) Chapter Nine – Developing MR Probes for Molecular Imaging. Adv Cancer Res. 2014;124: 297-327.
- Olatunde AO, Cox JM, Daddario MD, Spernyak JA, Benedict JB et al. (2014) Seven-coordinate coII, Fe(II) and six-coordinate Ni(II) amide-appended macrocyclic complexes as ParaCEST agents in biological media. Inorganic Chem 53(16): 8311-8321.
- Dorazio SJ, Tsitovich PB, Siters KE, Spernyak JA, Morrow JR (2011) Iron(II) PARACEST MRI Contrast Agents. J Am Chem Soc 133 (36): 14154-14156.
- Belle C, Bougault C, Averbuch MT, Durif A, Pierre JL (2001) Paramagnetic NMR investigations of high-spin Nickel(II) complexes. Controlled synthesis, structural, electronic, and magnetic properties of dinuclear vs mononuclear species. J Am Chem Soc 123 (33): 8053-8066.
- Nikolaou P, Goodson BM, Chekmenev EY (2015) NMR hyperpolarization techniques for biomedicine. Eur J Chem 21 (8): 3156-3166.
- Gallagher FA, Kettunen MI, Day SE, Hu DE, Ardenkjær-Larsen JH et al. (2008) Magnetic resonance imaging of pH in vivo using hyperpolarized 13C-labelled bicarbonate. Nature 453 (7197): 940-943.
- Schroeder MA, Swietach P, Atherton HJ, Gallagher FA, Lee P et al. (2009) Measuring intracellular pH in the heart using hyperpolarized carbon dioxide and bicarbonate: a 13C and 31P magnetic resonance spectroscopy study. Cardiovasc Res 86 (1): 82-91.
- Lee Y, Zacharias NM, Piwnica-Worms D, Bhattacharya PK (2014) Chemical reaction-induced multi-molecular polarization (CRIMP). Chem Commun 50 (86): 13030-13033.
- Flavell RR, von Morze C, Blecha JE, Korenchan DE, Van Criekinge M et al. (2015) Application of Good’s buffers to pH imaging using hyperpolarized 13C MRI. Chem Commun 51(74): 14119-14122.
- Düwel S, Hundshammer C, Gersch M, Feuerecker B, Steiger K et al. (2017) Imaging of pH in vivo using hyperpolarized 13C-labelled zymonic acid. Nat Commun 8 (1): 15126.
- Pascal W, Grashei M, Skinner JG, Suhnel S, Setzer N (2022) In Vivo pH imaging in rats using [1,5-13C2]Z-OMPD. ISMRM 0574.
- Pagel MD, Basilion JP (2011) Non-invasive imaging of genes and gene expression with magnetic resonance imaging and magnetic resonance spectroscopy. In: Molecular Imaging with Reporter Genes (Gambhir SS, Yaghoubi SS, Eds.), Cambridge University Press.
- Yoo B, Pagel MD (2008) An overview of responsive MRI contrast agents for molecular imaging. Front Biosci 13: 1733-1752.
- Hingorani DV, Bernstein AS, Pagel MD (2015) A review of responsive MRI contrast agents: 2005-2014. Contrast Media Molec Imaging 10: 245-265.
- Ekanger LA, Allen MJ (2015) Overcoming the concentration-dependence of responsive probes for magnetic resonance imaging. Metallomics 7: 405-421.
- Martinez GV, Zhang X, Garcia-Martin ML, Morse DL, Woods M, et al. (2011) Imaing the extracellular pH of tumors by MRI after injection of a single cocktail of T1 and T2 contrast agents. NMR Biomed 24 (10): 1380-1391.
- Frullano L, Catana C, Benner T, Sherry AD, Caravan P (2010) Bimodal MR-PET agent for quantitative pH imaging. Angew Chem Int Ed 49: 2382-2384.
- Pollard AC, de la Cerda J, Schuler FW, Pollard TR, Kotrotsou A et al. (2022) Radiometal-based PET/MRI contrast agents for sensing tumor extracellular pH. Biosensors 12(2):134.
- Pollard AC (2021) Contrast Agent Development for Molecular Imaging of Cancer. Rice University, Houston, TX USA.
- Raghunand N, Gillies RJ (2000) pH and drug resistance in tumors. Drug Resist Updat 3(1):39-47.
*Corresponding author: Dr. Shivanand Pudakalakatti, Department of Cancer Systems Imaging, University of Texas MD Anderson Cancer Center Houston, TX, 77054 USA
Citation: Shivanand Pudakalakatti (2022) Magnetic Resonance Techniques for Assessing in Vivo pH. Arch Cancer Res Med 2: 003
Received: June 05, 2022; Accepted: June 25, 2022; Published: June 30 2022
Copyright: © 2022 Shivanand Pudakalakatti. This is an open-access article distributed under the terms of the Creative Commons Attribution License, which permits un-restricted use, distribution, and reproduction in any medium, provided the original author and source are credited.
Shivanand Pudakalakatti1*, Renee Chin1,2, Mark D Pagel1,2 and Pratip K Bhattacharya1,2
Department of Cancer Systems Imaging, University of Texas MD Anderson Cancer Center Houston, TX, 77054 USA;
Citation: Shivanand Pudakalakatti (2022) Magnetic Resonance Techniques for Assessing in Vivo pH. Arch Cancer Res Med 2: 003
Received: June 05, 2022; Accepted: June 25, 2022; Published: June 30 2022
Copyright: © 2022 Shivanand Pudakalakatti. This is an open-access article distributed under the terms of the Creative Commons Attribution License, which permits un-restricted use, distribution, and reproduction in any medium, provided the original author and source are credited.
Shivanand Pudakalakatti1*, Renee Chin1,2, Mark D Pagel1,2 and Pratip K Bhattacharya1,2
1Department of Cancer Systems Imaging, The University of Texas MD Anderson Cancer Center, Houston, USA
2MD Anderson Cancer Center, UTHealth Graduate School of Biomedical Sciences, Houston, USA
